The conclusion of 2020 left each of us experiencing a combination of change, adjustment, loss or struggle. However good or bad (or some roller-coaster variation of both), the year saw pockets of positivity and noteworthy change that reminded us to be optimistic for the long term. Due to the pandemic, the phrase “how to donate” was searched on Google two times more than “how to save money,” showing the resilience and focus we collectively have on helping others. To provide perspective on the fourth quarter and all of 2020, we have gathered a short list of market and economic anomalies as we make our way in the new year.
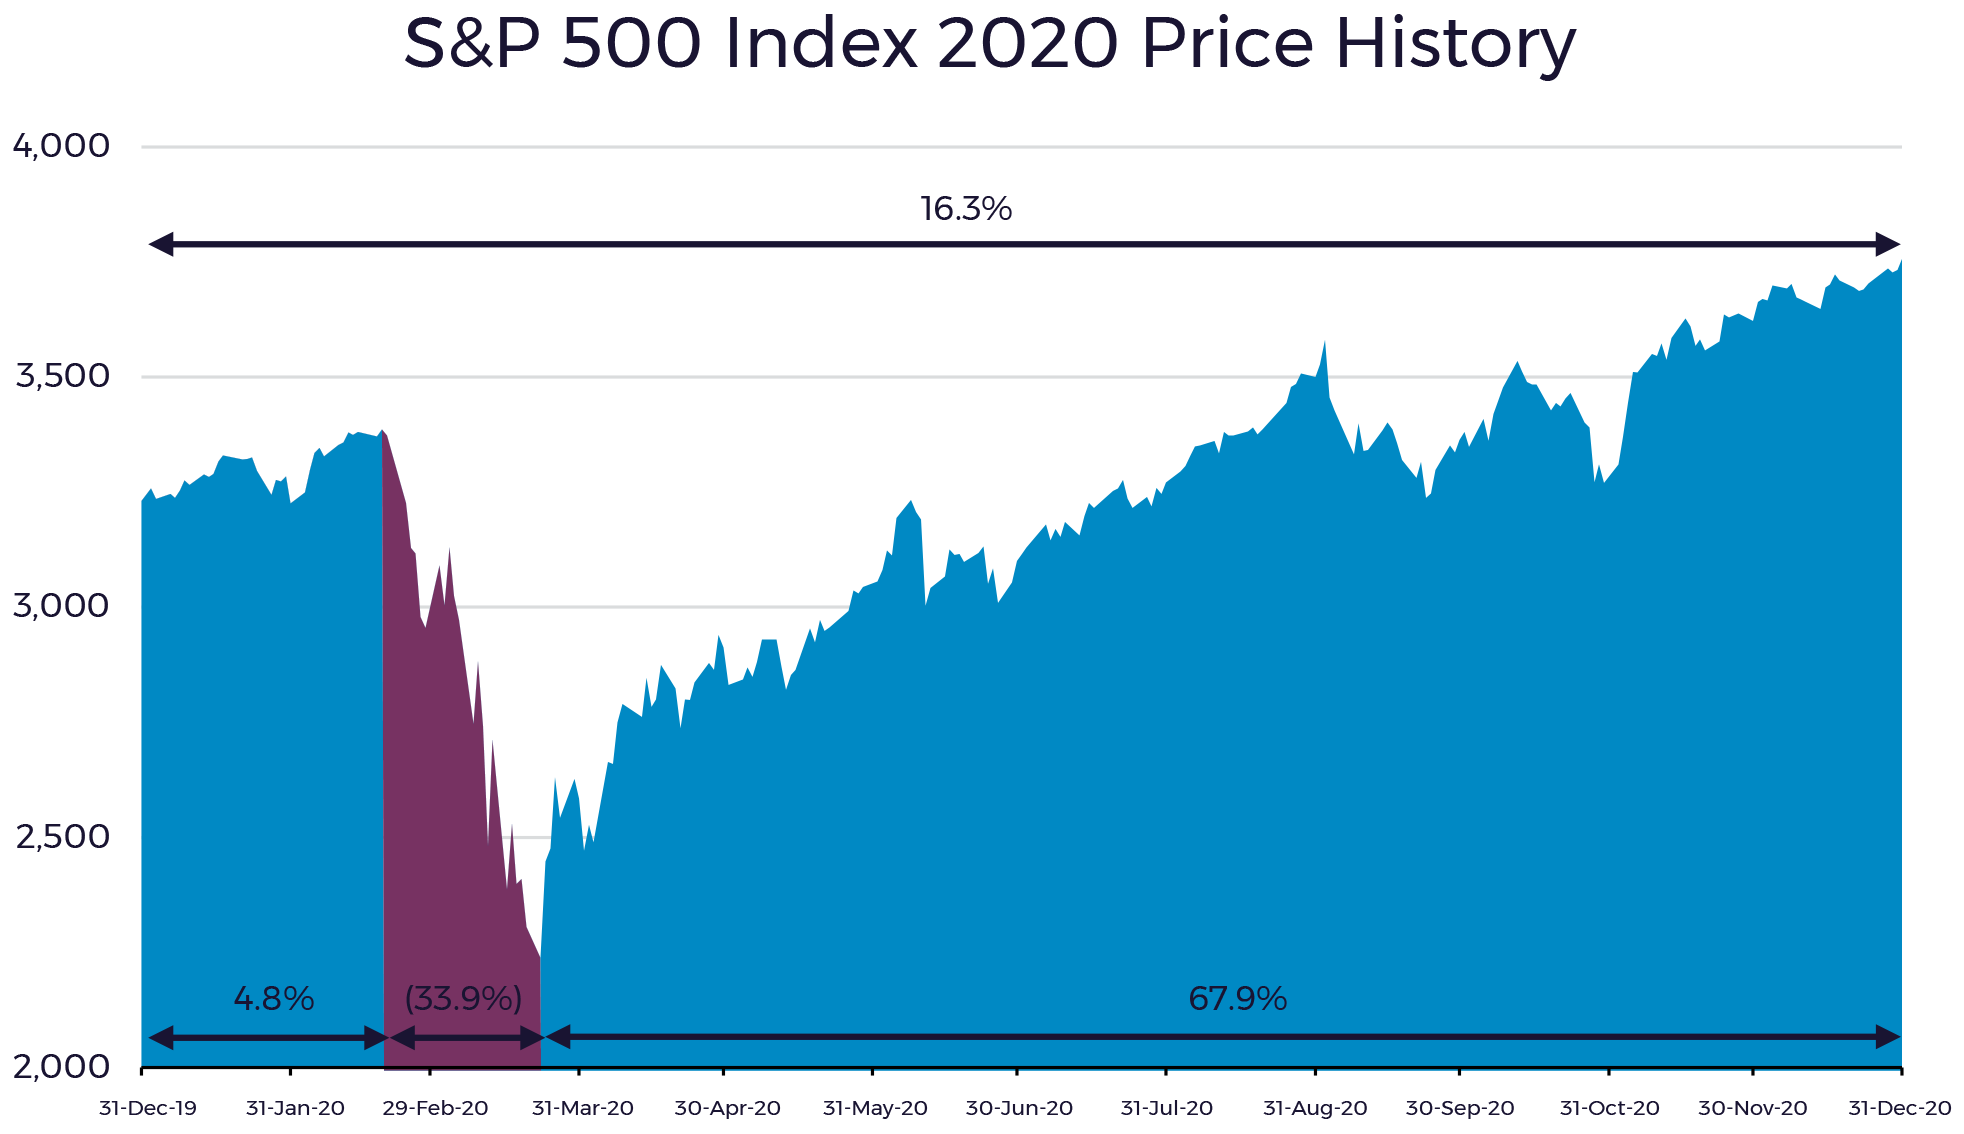
1. The stock market began the year in a bull market, saw its fastest-ever bear market and ended the year in what could be viewed as the next bull market.
The S&P 500 Index climbed to its then record high on February 19 as the year began. This was followed by a 33.9% decline over 23 trading days into late March in large part due to the ensuing pandemic and economic fallout that followed.
Since the low on March 23, the S&P 500 finished the remainder of the year up 67.9% and has recently hit its all-time high on December 31. Previously, we have written about the importance of remaining invested for the long run, as recoveries can tend to happen quite quickly. As investors, we need to recognize that large company indexes like the S&P 500 are less diversified today than they have been in the recent past, and as a result, make sure we are maintaining diversification across other assets classes.

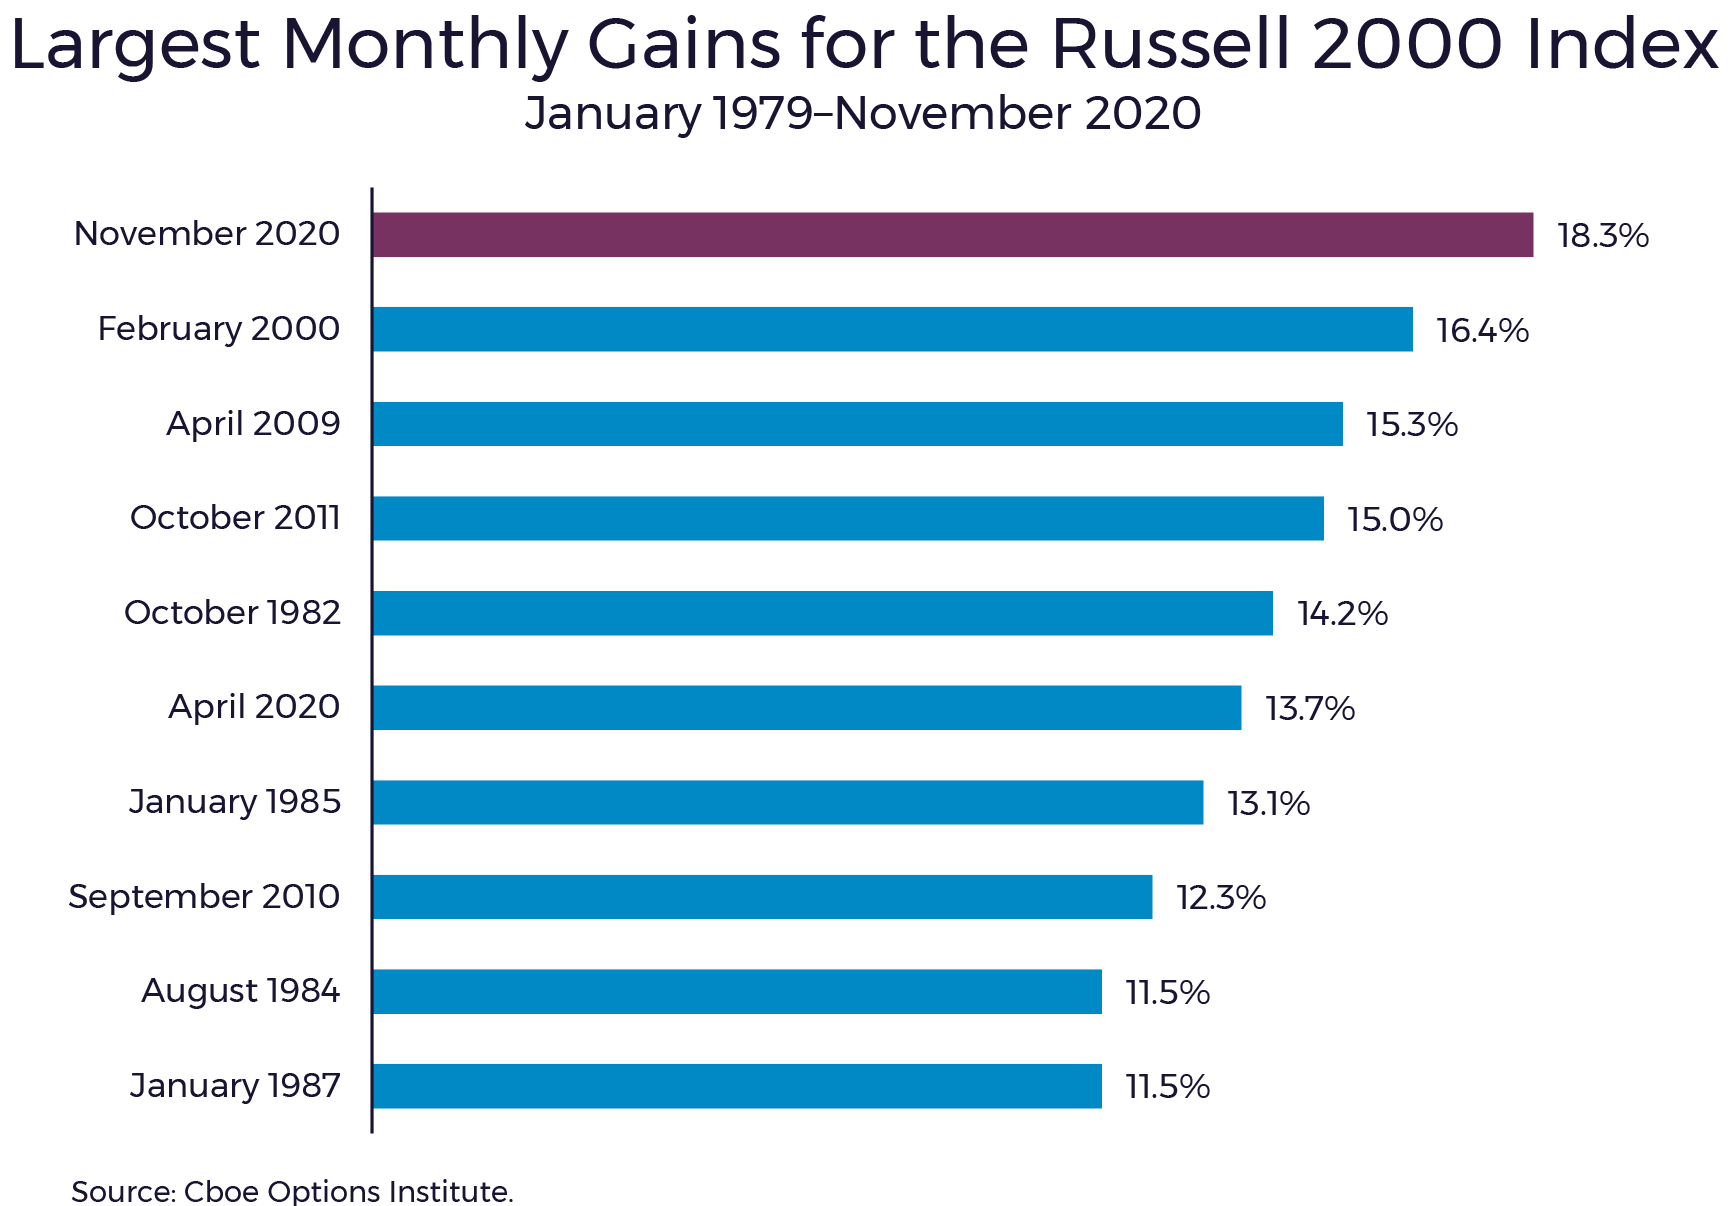
2. The Russell 2000 Index had its best month in November 2020 since the index launched.
With the outcome of the election slowly being determined and with updates on vaccines by major biopharmaceutical companies, the Russell 2000 Index (an index comprised of small company stocks) had its biggest monthly gain since the index’s inception more than 40 years ago. The Russell 2000 returned 18.3% in November, versus returns for the Russell 1000 Index (an index of large company stocks) and the S&P 500 of 11.6% and 11.0%, respectively. The chart below shows the 10 months with the largest percentage gain for the Russell 2000 since inception.1

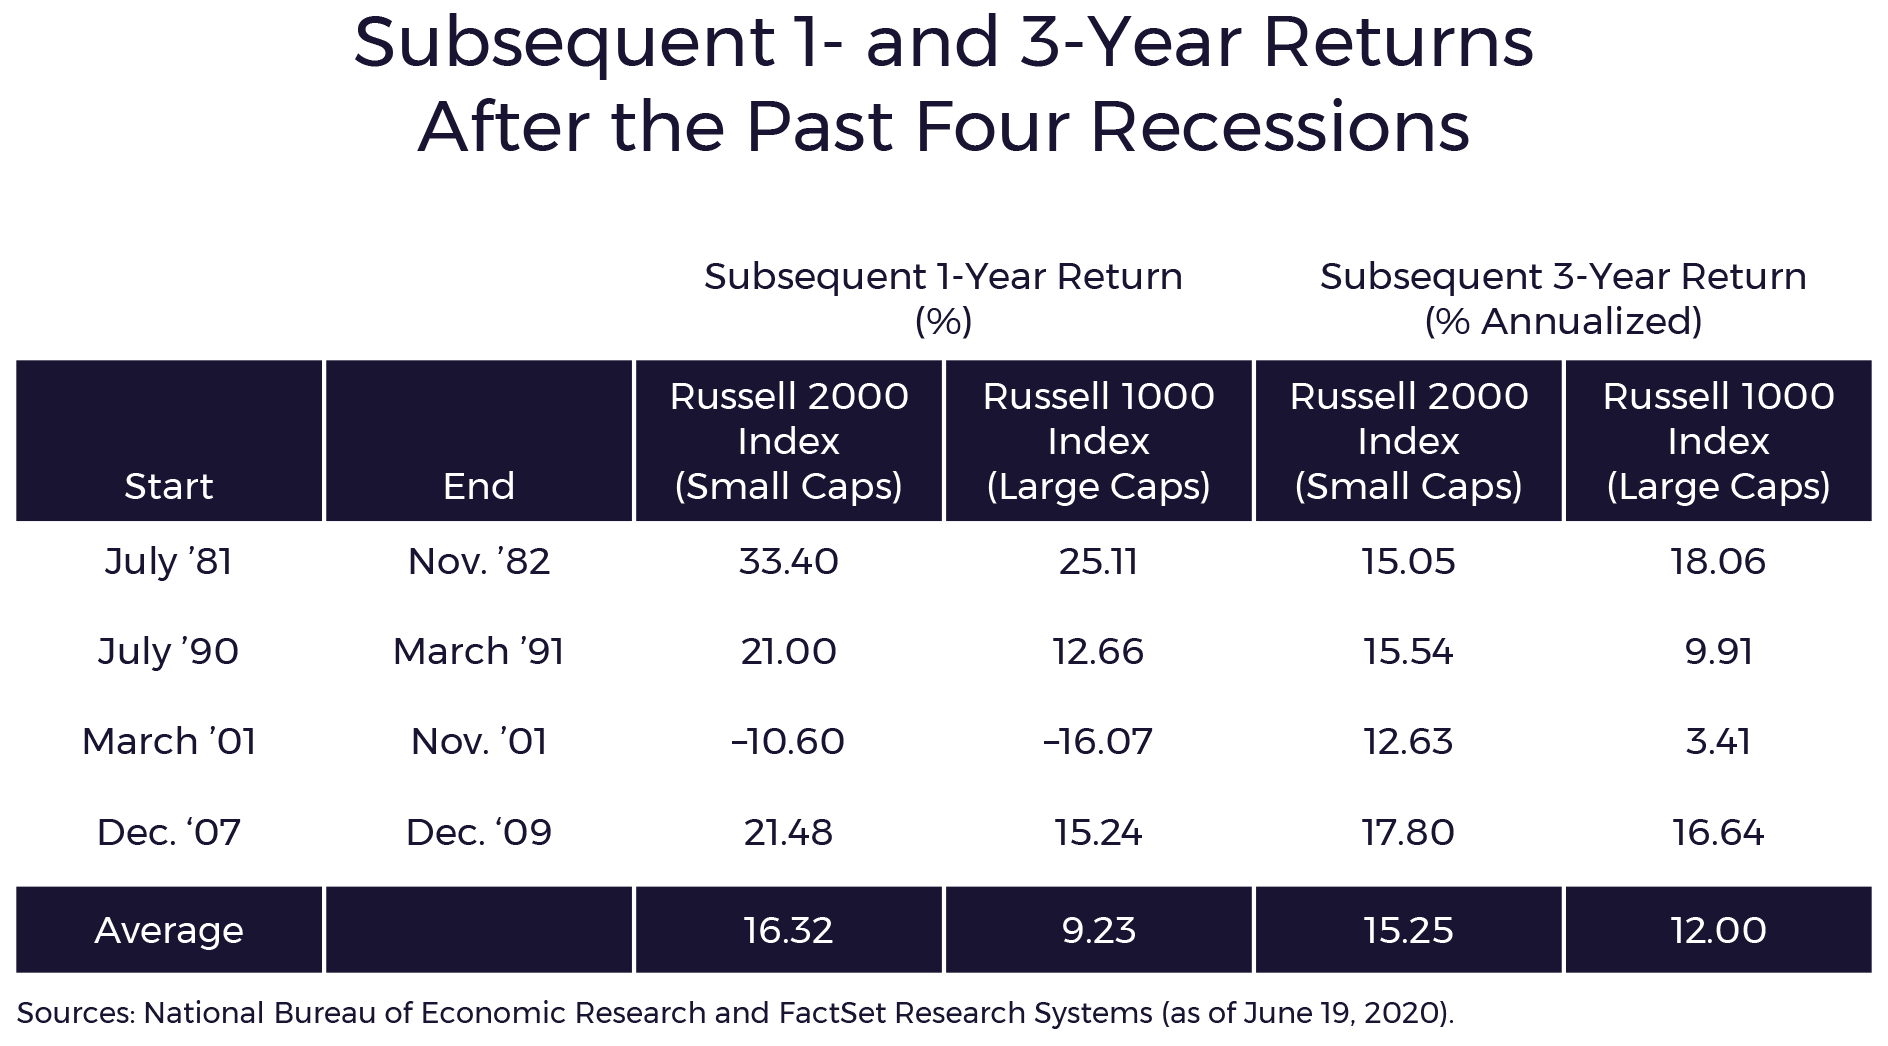
Over the prior four recessions that occurred before 2020, the Russell 2000 has outperformed the Russell 1000 by 7.1% in the subsequent 1-year period and by 3.3% in the subsequent 3-year period, on average. Since the market lows in March 2020, the Russell 2000 has outperformed the Russell 1000 by 21.5% (using Vanguard’s Russell Index ETFs as a proxy). The Russell 2000 comeback is important to note for your portfolio since our portfolios are statistically tilted toward small companies. The table below shows the 1-year and 3-year performance of the Russell 1000 and 2000 indexes following the prior four recessions.2

3. Q4 inflows to emerging market bonds, stocks and currencies were at an 8-year high.
Data from the Institute of International Finance (IIF) show that foreign-investor appetite for emerging market assets was nearly the strongest since the first quarter of 2013. According to the IIF, November alone saw inflows of $145 billion.3 With low interest rates and historically high stock valuations in developed countries, it appears investors are turning to emerging market assets to capture higher yields and higher stock expected returns. This is important to note for your portfolio as we look to diversify — not only globally diversifying around stocks but also among different asset classes.
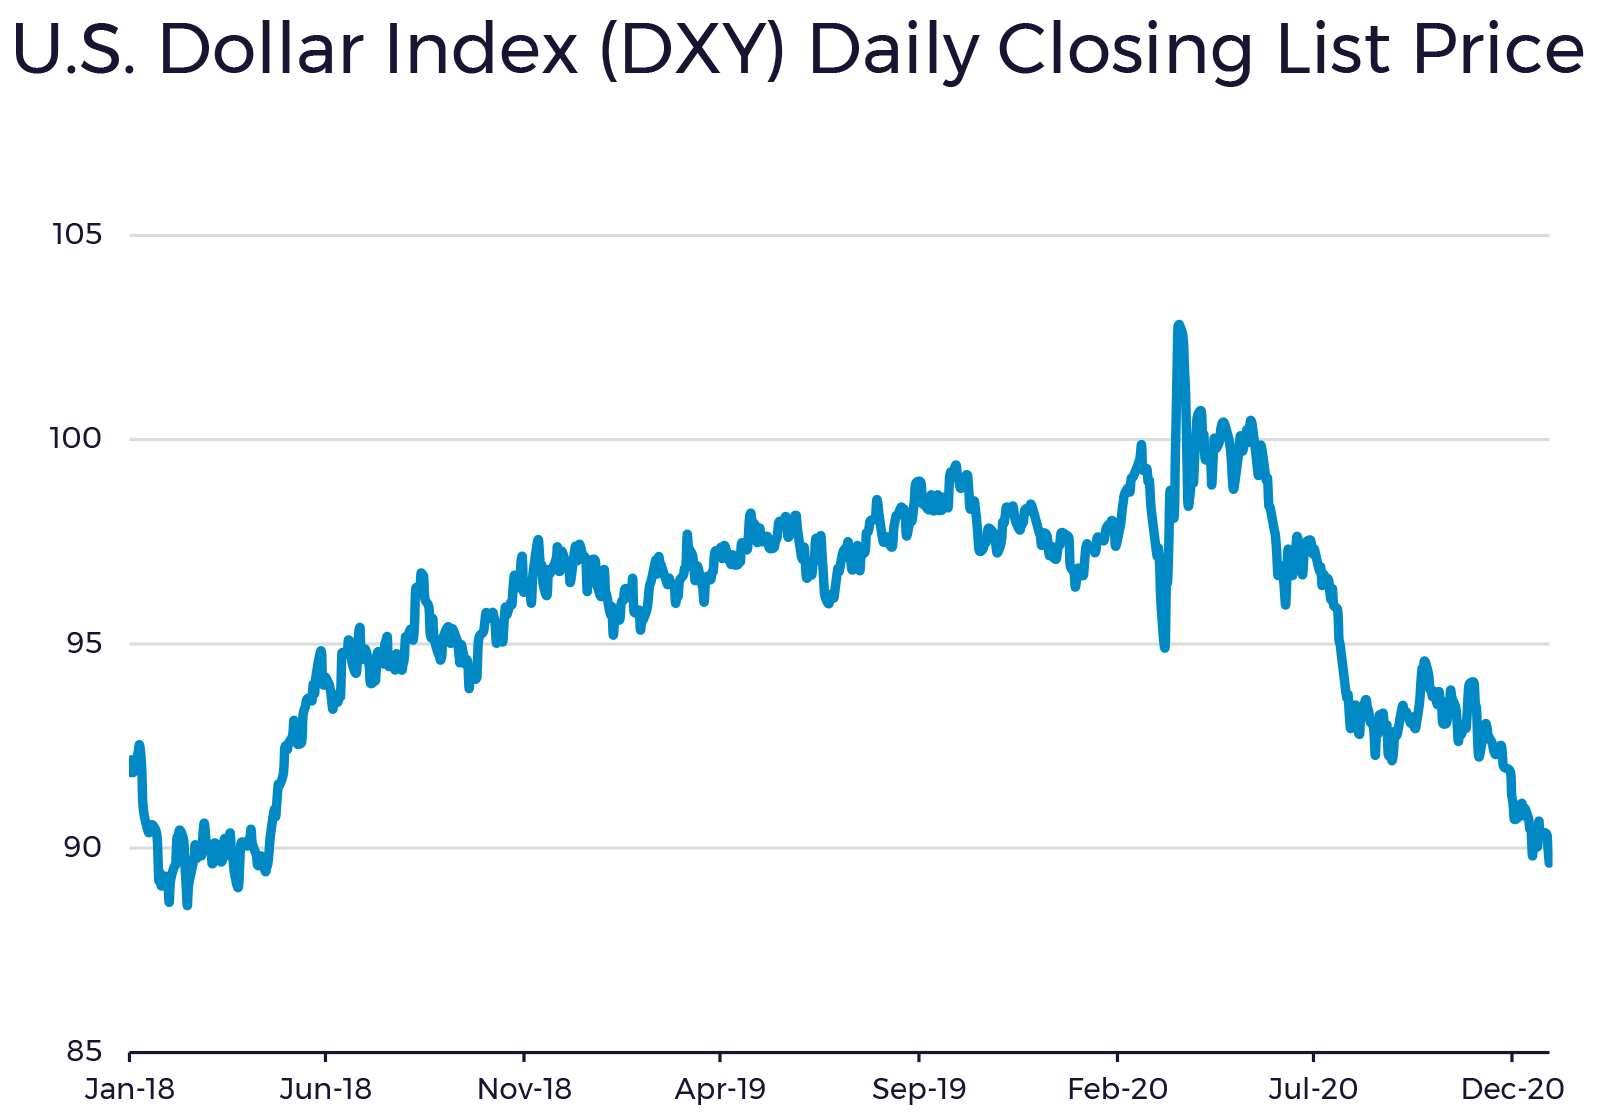
4. U.S. dollar index reached its lowest point since April 2018 and neared its worst Q4 performance since 2003.
The U.S. dollar has weakened this year and finished at its lowest level in two years. The low domestic interest rates and a subsequent appetite for risk in foreign assets have contributed to the weak performance in the U.S. currency for the year. During Q4, the dollar lost 4.5%, which represents the worst Q4 performance since a 6.4% loss in Q4 2003. There are economic positives to a weaker U.S. dollar since goods and services provided by U.S. companies become more affordable globally. For investors, international holdings are relatively helped by a weaker U.S. dollar, so a globally diversified portfolio such as ours takes advantage of this movement.

5. Through the remainder of 2020, roughly 42% of the U.S. workforce remained fully remote versus an estimated 8% in February.
The Federal Reserve Bank of Dallas estimated that 8% of the U.S. workforce worked fully remote in February 2020, which then spiked to 35% in May.4 A survey conducted in Q4 by Upwork, reaching 1,000 small business owners, HR managers and CEOs, concluded that 41.8% of the U.S. workforce continues to be fully remote nine months into the pandemic.5 We continue to stay connected to our clients through the use of technology — whether by video conferencing, email or phone — through this period and beyond.
As much as we wanted to fast forward at times throughout the year, 2020 will not be forgotten. Our conclusive thoughts on the market performance this year are not dissimilar from the perspective we shared at this point one year ago, which is still relevant (“The Market Has No Memory” by David Booth).
We reminded ourselves of the need to stay the course and remained disciplined following market corrections similar to those experienced last year. Here is to hoping for a much more “boring” 2021.
SOURCES
1 Matt Moran, “The Trends Behind the Russell 2000 Index’s Record Monthly Gain.” Cboe, December 9, 2020.
2 Matthew Ziehl, Adam Weiner and Jason Farrell, “Small-Cap Stocks Have Historically Outperformed After Recessions.” Invesco, June 30, 2020.
3 Jonathan Wheatley, “Foreign Investors Dash into Emerging Markets at Swiftest Pace Since 2013.” Financial Times, December 17, 2020.
4 Alexander Bick, Adam Blandin and Karel Mertens, “Commuting Patterns During COVID-19 Endure; Minorities Less Likely to Work From Home.” Federal Reserve Bank of Dallas, September 1, 2020.
5 Lori Ioannou, “1 in 4 Americans Will Be Working Remotely in 2021, Upwork Survey Reveals.” CNBC, December 15, 2020.


