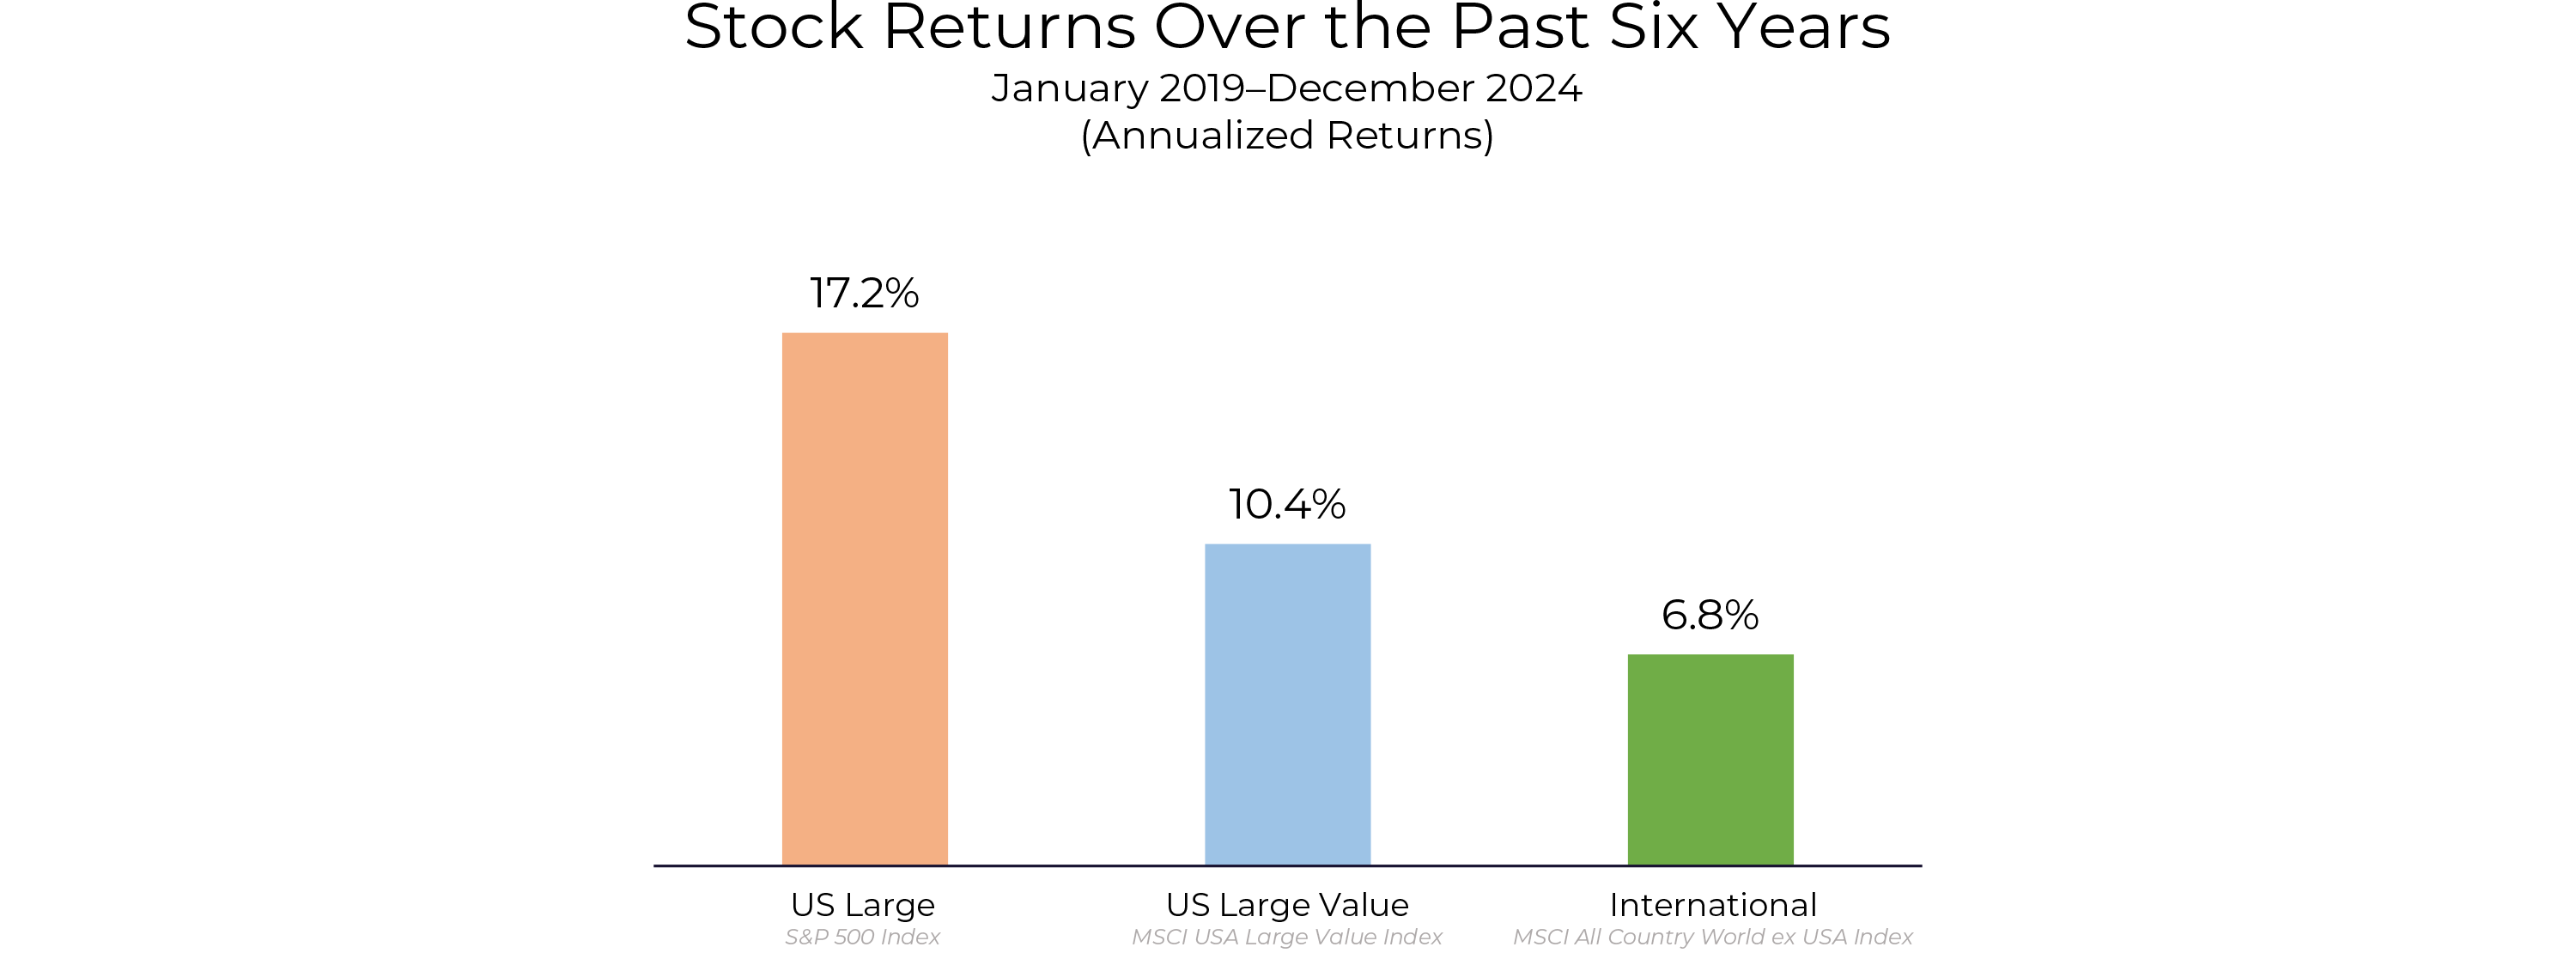
The stock return of US Large companies over the last six years has been an extraordinary outlier. During that same period, the stock return of US Large Value companies was slightly higher than we would expect. International companies have done slightly worse than we would expect. It seems simple, but it is an important point.

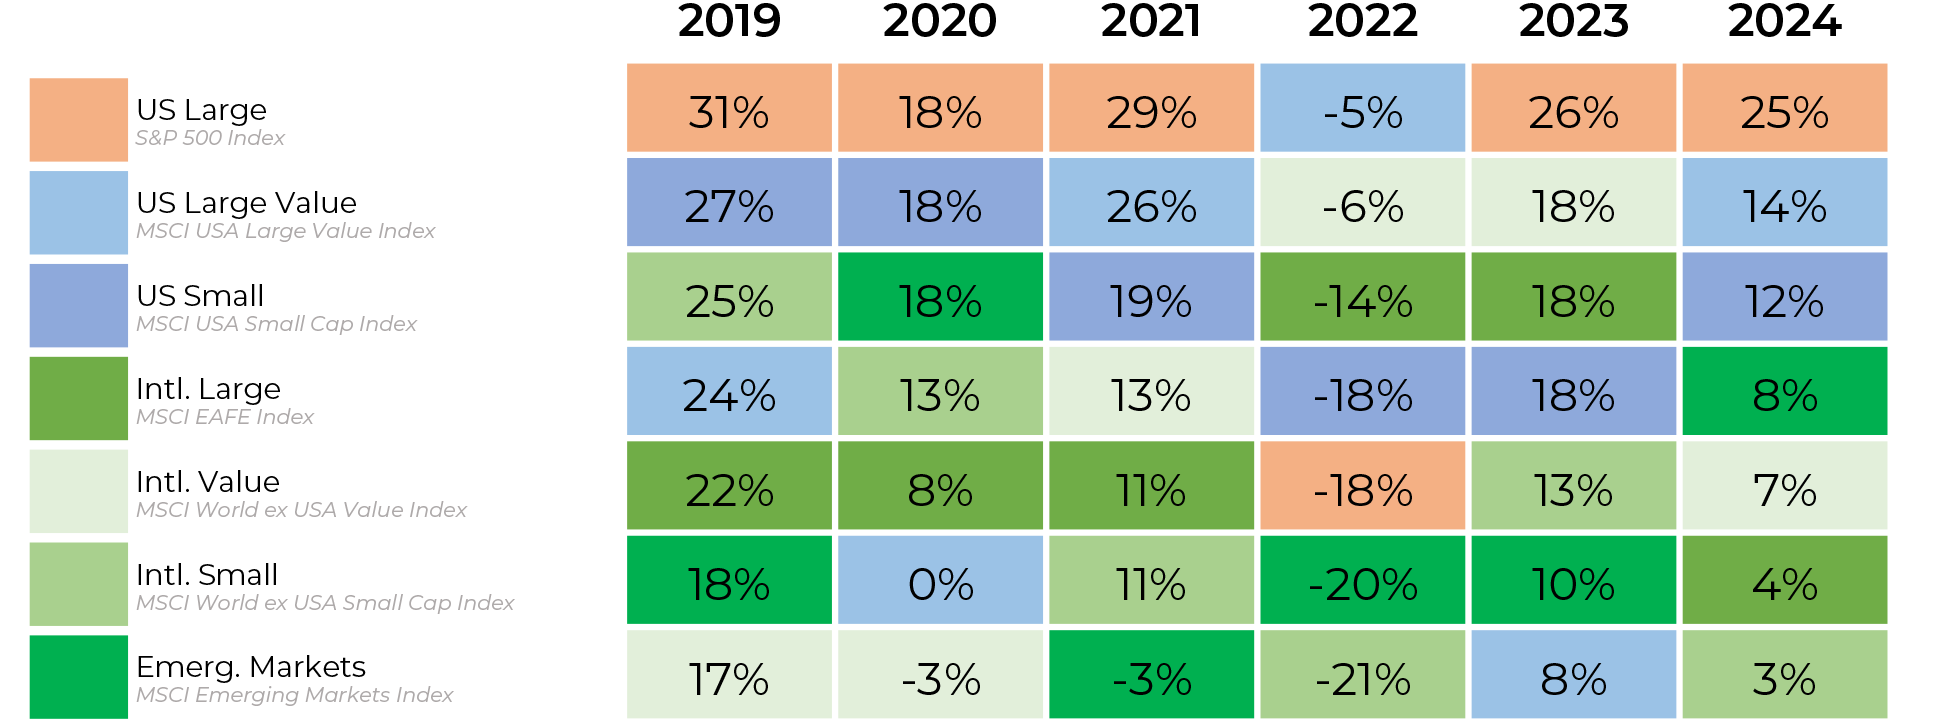
Another way to visualize this is the following chart ranking asset classes of stocks. US Large has been the top-performing asset class in five of the last six years. An incredible run.

Quite a few explanations have been offered to rationalize the recent outperformance of US Large. The US dollar is strong. The big tech companies are all-in on AI, a trend that many expect to continue for years to come. And the US business environment — with its innovative and entrepreneurial spirit — seems set up for success.
Alternatively, the AI reverie may pop like the tech bubble. Geopolitical risks may reignite either in Ukraine or the Arctic. The US dollar could depreciate as debt levels become unsustainable.
Our approach to investing is not based on which of these things will happen. Instead, we hold a diversified set of investments that hopefully maximizes the number of possible futures in which our portfolio can still be successful despite what happens.
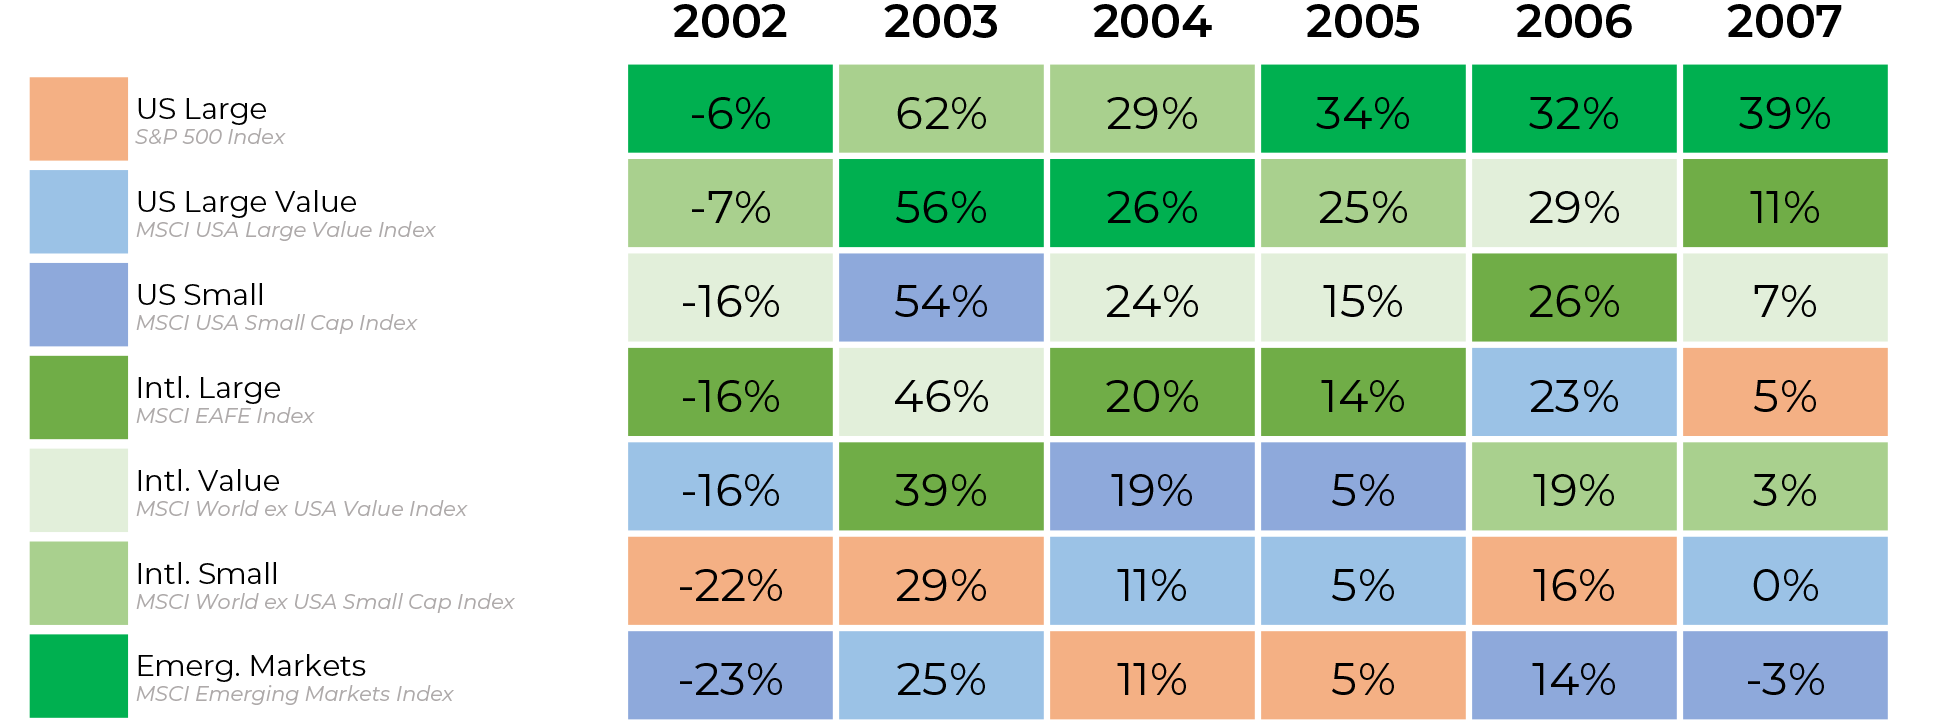
The coin can flip. The same chart looked exactly the opposite from 2002 to 2007, when US Large occupied the bottom two rows of the chart for five out of six years. International and Emerging Markets stocks dominated the top of the chart for years. Similar to now, there were plausible stories to rationalize the returns. International companies were dominating world trade, taking advantage of cheaper labor markets and expanding rapidly as they sold their goods to the increasingly affluent billions of people in their local markets.

The parable-like wisdom being that a person who bought and held the S&P 500 through both these periods is neither a genius nor a dullard. They have just gotten lucky lately. It is a helpful tale that cautions against reading too much into any extraordinary market run.
A Closer Look at US Large
US Large could certainly continue rocking out for a while longer. However, one fundamental concept we believe to be true is that what price you pay for a stock matters.
If one company is 2X better than another similar company (we will leave the definition of better up to the reader), but its price is 4X higher than that other company, is it a good investment? Presuming your definition of better captures things like future growth expectations and comparative advantages, then probably not.
The recent outperformance of US Large, and in particular US Large Growth, has not been driven primarily by higher earnings of US Large Growth companies, regardless of whether comparing to Value or International stocks.
One way to illustrate this point is to directly compare the rise in earnings to the rise in price. From October 2014 to September 2024, the price of US Large Growth companies rose +300% while earnings only rose +137%.1 This implies that most of US Large Growth’s return has been from valuation expansion rather than earnings growth.
Now, Let’s Include International Stocks
For International, we will use a ratio of what it costs to buy a stock to its earnings, which is called the PE ratio. The PE ratio measures how expensive it is to buy a dollar of earnings of different companies.
This is similar to comparing the price per pound of tilapia versus salmon at the grocery store. You may prefer one fish over the other, so you would be willing to pay more for it. But, recalling our earlier example, if the price for salmon goes from twice as expensive as a pound of tilapia to four times as expensive, some consumers will switch to making fish tacos for dinner instead of salmon.
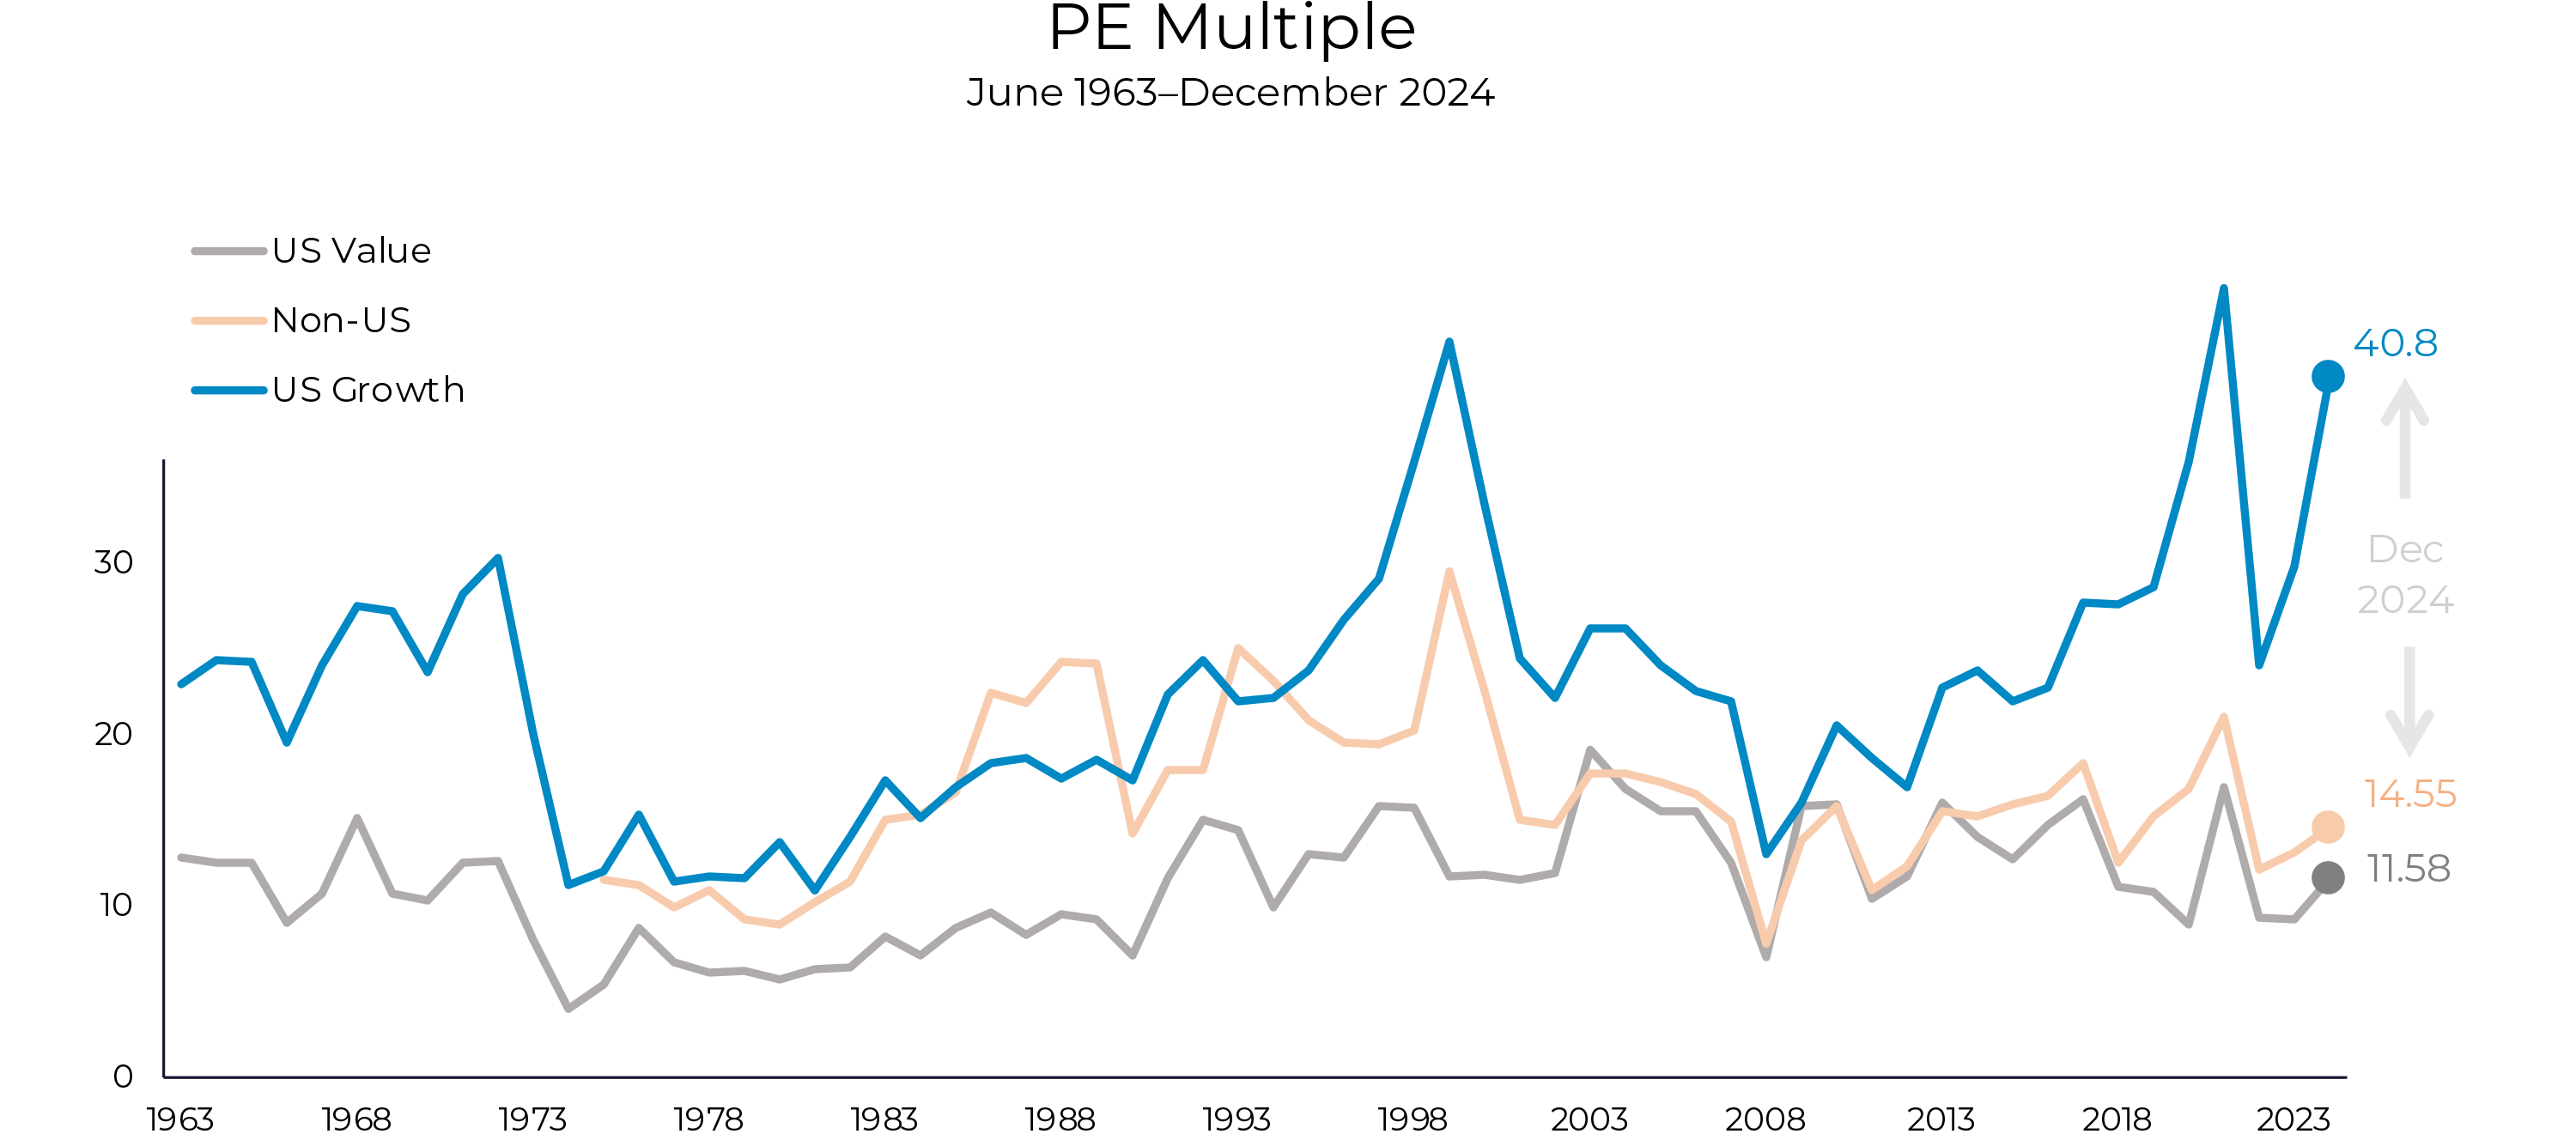
In the chart below, you can see that the price to buy a dollar of US Growth companies’ earnings is very expensive, historically speaking.2 You have to pay over $40 for each dollar of earnings. Meanwhile, US Value stocks and International stocks are well within their normal range. Now, Growth companies tend to be stronger companies and should expect to garner a premium. The question of the day is whether they are that much better than their counterparts than they used to be.

Recall the earlier example of a hypothetical company that is 2X “better” but has a 4X higher price. That is essentially what we are seeing in this chart. US Growth companies used to be about 2X the price of US Value companies, but the recent expansion has resulted in US Growth companies garnering about 4x the price today. International has varied a bit more in the past but currently are priced very similarly to US Value companies.
Another interesting data point is that US Small companies’ earnings went up almost as much as US Large Growth companies’ earnings for the period we looked at earlier (October 2014 to September 2024). While US Small companies’ earnings went up +135% (compared to US Growth up +137%), their price only went up +90% (compared to US Growth up +300%). This again implies US Growth’s exceptional price appreciation is not just driven by the exceptional profit growth of these companies, as smaller companies realized similar results but their price per dollar of earnings went up by much less.
Given the high valuations and how extraordinary this US Large Growth run has been, our best guess is that the next 10 years will look a lot different than the past several years. There is little evidence in the short term that high PE ratios (or derivations thereof) can predict the coming year’s return. At best, the research suggests US Large Growth should have lower-than-average returns over the next 10–20 years, but the short term is very much unknown.3
Conclusion: US Large Growth Is Perhaps a Friend and a Foe Right Now
There are great things about US Large Growth doing well.
First and foremost, if you are a US investor, you probably own a lot of it. The factor-tilted stock allocation that Forum created called Global Neutral Portfolio holds 37% in S&P 500 stocks.4 When you consider that portfolio holds stocks of 13,457 companies, that much of an allocation to about 500 of them is a pretty substantial weighting.
If US Large Growth keeps doing well, you will be glad you own it. When we consider all the evidence, we think the best plan is to own many asset classes and stay diversified.
SOURCES
1 “What Today’s Valuations Are Telling Investors.” Avantis Investors® By American Century Investments®, October 2024. https://www.avantisinvestors.com/avantis-insights/what-todays-valuations-are-telling-investors/.
2 Data provided by Dimensional Fund Advisors. US Value as proxied by the Fama/French US Value Index. International as proxied by the Fama/French Developed ex US Market Index. US Growth as proxied by the Fama/French US Growth Index.
3 András Vig, “Applied Philosophy: The Shiller P/E and S&P 500 Returns.” Invesco, January 29, 2024. https://www.invesco.com/apac/en/institutional/insights/market-outlook/applied-philosophy-the-shiller-PE-and-SP-500-returns.html.
4 As of 12/31/2024 as provided by Dimensional Fund Advisors, weighting is currently DFAC 27.4%, DUHP 10.8%, DFAT 15.7%, DFIC 12.3%, DIHP 6.2%, DISV 6.2%, DFEM 9.4%, and DFGR 12.0%.
For further reading, we recommend the facetious article from Cliff Asness: 2035: An Allocator Looks Back Over the Last 10 Years.
All investment strategies carry the potential for both profit and loss, and different types of investments involve varying levels of risk. Past performance is not indicative of future results and should not be relied upon as a guarantee of future success. Consequently, it should not be assumed that the future performance of any specific investment or strategy will be profitable, suitable for your portfolio or individual circumstances, or otherwise successful. Furthermore, any information presented should not be interpreted as a receipt of, or substitute for, personalized investment advice from Forum.
Historical index performance data referenced, directly or indirectly, is based on information from the respective copyright holders, trademark owners, or publication/distribution right owners of each index. Index performance does not account for the deduction of transaction fees, custodial charges, or management fees, which would reduce historical performance results. Indexes are unmanaged, and investors cannot invest directly in an index.
By clicking on a third-party link, you will leave the Forum website. Forum is linking to this third-party site to share information in a different format and is for informational purposes only. However, Forum cannot attest to the accuracy of information provided by this site or any other linked site. Forum does not endorse the site sponsors or the information or products presented there. Privacy and security policies may differ from those practiced by Forum.


